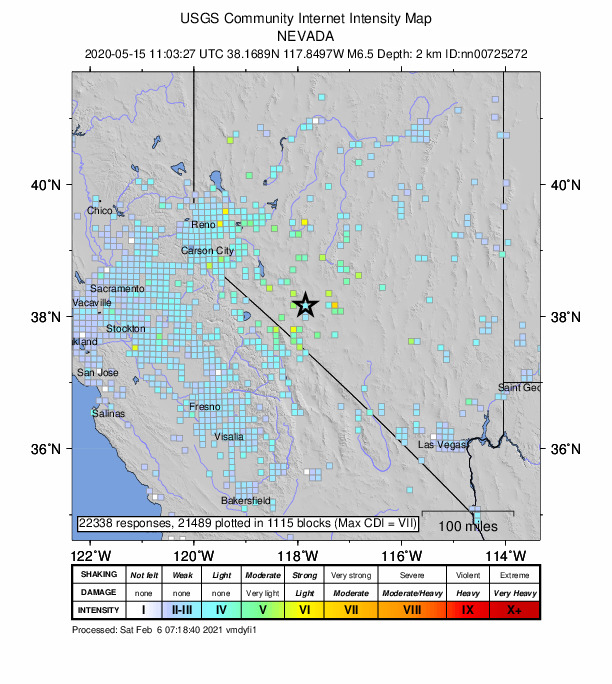
Featured image: A USGS “Did you feel it?” map for a M6.5 earthquake that occurred in the Monte Cristo Range in Nevada on May 15th, 2020 (public domain)
Paper: Which earthquake accounts matter?
Authors: Susan E. Hough and Stacey S. Martin
Seismologists who study earthquakes spend much of their time looking at wiggly lines that represent recordings of ground motion from seismometers, but in places where those data aren’t available, we often turn to what we call “macroseismic” data: eyewitness accounts from people who felt the shaking. But when we ask people on the ground, “Did you feel it?,” who is answering?
A recent study by Hough and Martin uses census data to dig into the demographics behind eyewitness earthquake reports. They analyze earthquake reports from the United States Geological Survey, which has collected “Did you feel it?” (DYFI) reports online for the past 20 years, for earthquakes both in the U.S. and abroad. Hough and Martin look at several recent earthquakes in Southern California and in India. By aggregating population data over small geographic areas (U.S. zip codes and raster census classes in India), they are able to compare rates of earthquake reporting to demographic data like average household income and literacy rates.
In the U.S., the authors found that people submitted DYFI reports at roughly equal rates across different average income levels. This suggests that even though the population submitting these reports is completely self-selected, the dataset isn’t coming only from the wealthiest Californians but is instead including information from people across a wide range of socioeconomic backgrounds.
In contrast, similar data collected in India show that DYFI reports from earthquakes come overwhelmingly from more affluent urban areas rather than rural ones. The authors also found that people living in areas with high literacy rates submitted most of the reports. These findings are not necessarily surprising, since the system for submitting these reports is online and is currently only available in English, but it highlights the potential weaknesses of data gathered from a self-selected group of volunteers.
Examining potential biases in this community data is crucial when we start to think about how the data are used. We rely on macroseismic data fill in the gaps between seismometers, even in densely instrumented places like Southern California. If DYFI reports are coming from a representative cross section of the population, evenly distributed across the map, then those data can help us understand patterns of shaking intensity and prepare for future quakes. But what if a big earthquake happens in a rural area, and the only people who report it live far away in an urban center that felt only modest shaking? Relying on that data could bias the models we use to predict things like the amount of damage future earthquakes could cause in different areas.
Even in Southern California, we’ll never have as many seismometers there are people, so DYFI reports are and will remain an important data source for seismic hazard assessment. But Hough and Martin have shown that these data shouldn’t be used blindly: in the words of M. C. Hammer, “When you measure, include the measurer.”
Taking the measure of the measurer by Hannah Mark is licensed under a Creative Commons Attribution-ShareAlike 4.0 International License.