Cracking the code of the caramel crust

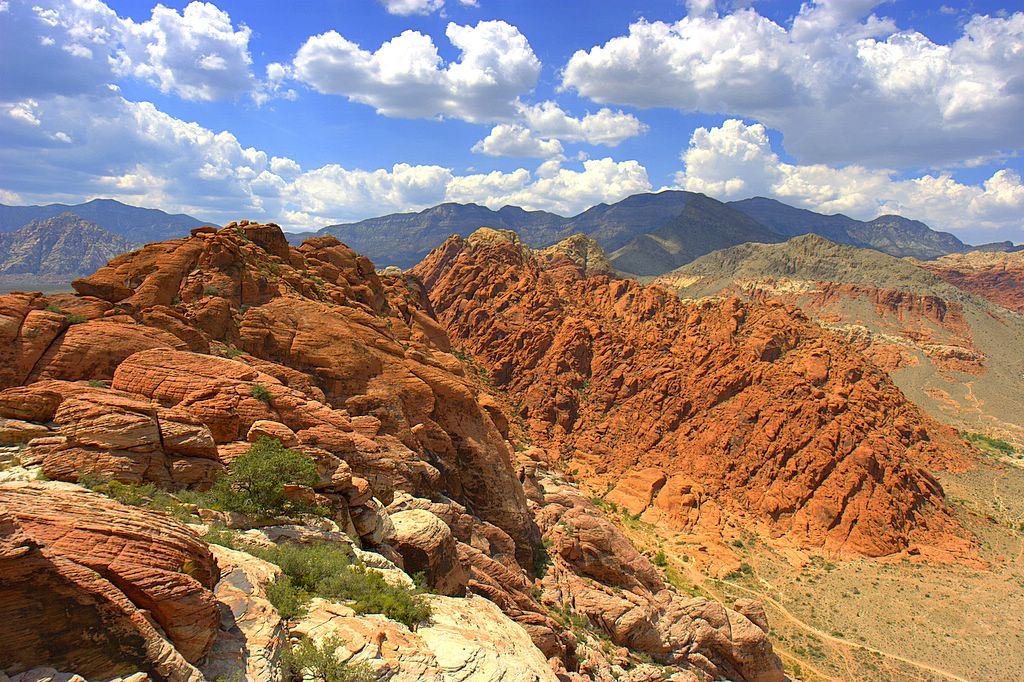
Featured image: a view of the Calico Basin in the eastern part of the Mojave Desert. Photo by Fred Morledge, CC BY-SA 2.5, via Wikimedia Commons.

Paper: Thin crème brûlée rheological structure for the Eastern California Shear Zone
Authors: Shaozhuo Liu, Zheng-Kang Shen, Roland Bürgmann, & Sigurjón Jónsson

A recent paper by Liu and colleagues aims to answer a fundamental question in geodynamics: are Earth’s tectonic plates more like a jelly sandwich, or a crème brûlée? It may sound silly, but these two models for crustal strength describe how tectonic plates might respond to stress changes due to earthquakes.

Continue reading “Cracking the code of the caramel crust”

Himalayan Glaciers: A Store House of Picturesque Landforms

Himalayan Glaciers A Store House of Picturesque Landforms

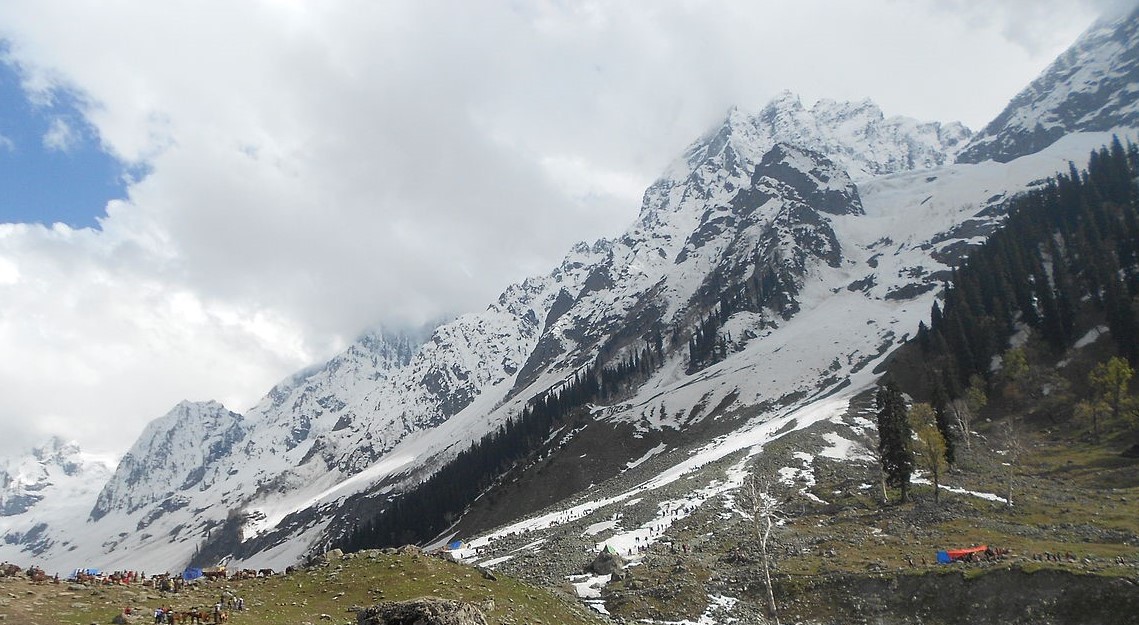
Featured image: Thajwas Glacier from Wikipedia under CC BY-SA 4.0.

Paper: Glacial-geomorphic study of the Thajwas glacier valley, Kashmir Himalayas, India

Authors: Reyaz Ahmad Dar, Omar Jaan, Khalid Omar Murtaza, Shakil Ahmad Romshoo

Glacial retreat caused by climate change is an urgent problem around the globe, as glaciers which hold 68.7% of our freshwater sources are rapidly melting. There are several regions around the world where snow covers the whole region almost all the year round. These places are not only a place for tourist destinations but are also covered with various landscape features which carry vital information related to past glacial activities, including both the advancement and the retreat of glaciers that occurred during the Late Glacial Maximum.

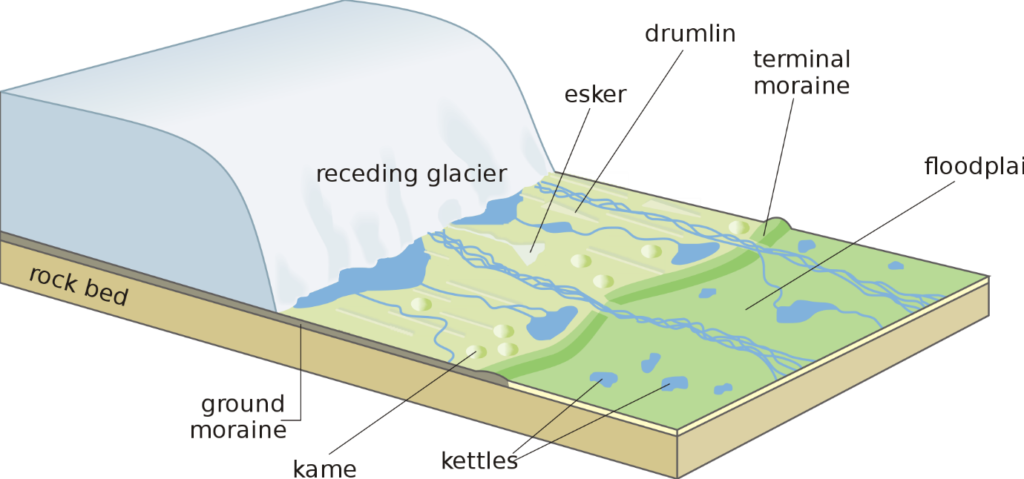
In a new research study on Thajwas Glacial Valley in Sonamarg which is located in the upper reaches of the Indus River in Kashmir Himalayas, the researchers studied the available glacial-geomorphic features of the region. The geomorphic landforms shaped by the glaciers provide scenic landscape beauty to the region. The reconstruction of palaeo-glacial features of the region is assisted by the development of different landforms in the valley such as cirques, characterized as amphitheatre shaped valleys, glacial troughs or U-shaped valleys, and terminal moraines which forms at the end of the glaciers.

The researchers developed a glacial-geomorphic map featuring all the available glacial landforms features of the valley as well as the behaviour of the past glaciers with the help of input from both field observations and geomorphic information collected from satellite imagery and Google Earth. The major bedrock lithological formation of the region consists of Panjal Volcanics composed of basaltic rocks interposed with pyroclastic materials produced by volcanic activities. Various glacial landform features have been mapped with ground-based observations in the area. Small-scale features such as erratic boulders, kettle holes, glacial meltwater streams, etc. have also been mapped for the region using images from Google Earth. These glacial landforms vary in size from one meter to more than hundreds of meters.

A schematic of glacial landforms. Source: Wikimedia

In the Kashmir Himalayas, the process of glaciation has resulted in complex topographical features as an outcome of landscape evolution. Evidences found for the advancement of glaciers in the Great Himalayan mountain range near the Kashmir Valley. This research suggests that the glaciers in the Kashmir Himalayan region are showing signs of depletion as well as recession as an impact of recent warming observed in the region. The satellite data revealed the expansion of Thajwas Valley at the expense of retreating cirques of tributary glaciers. The presence of steep slopes on the north-eastern side is evidence of fluvial incision i.e., the process of narrow erosion by a river far from its base level, with slight glacial erosion; on the other hand, the gentle slope found on the south-western side is a result of the retreat of the cirque due to erosion.

During the Late Quaternary period, the Valley of Kashmir has experienced cycles of glacial and interglacial activities. Global cooling led to the growth of the glaciers together with high rates of erosion which shaped the landscape of the region. Serrate ridge present in the area indicates a gradual lowering of the ice levels. Recessional moraines, kettle hole and outwash plains observed in the region indicates the deglaciation process owing to climate change. The region has experienced substantial glacial and climatic fluctuations during the Late Quaternary period. Using area scaling method the researchers estimated that the Thajwas glacier has lost 88% of its volume after its last advancement. Presently, the Thajwas glacier is estimated to have lost 81% of its surface area.

Our lives are indirectly dependent on the glaciers, as they control the climatic balance and other geographical phenomena occurring on the earth. Research into the retreat of these glaciers is imperative to understand how we can preserve this indispensable natural resource for a sustainable life.

Himalayan Glaciers: A Store House of Picturesque Landforms by Shilpa Saha is licensed under CC BY-SA 4.0 

There’s microplastics in the Arctic, and we can probably blame home laundry

Microplastic Thread

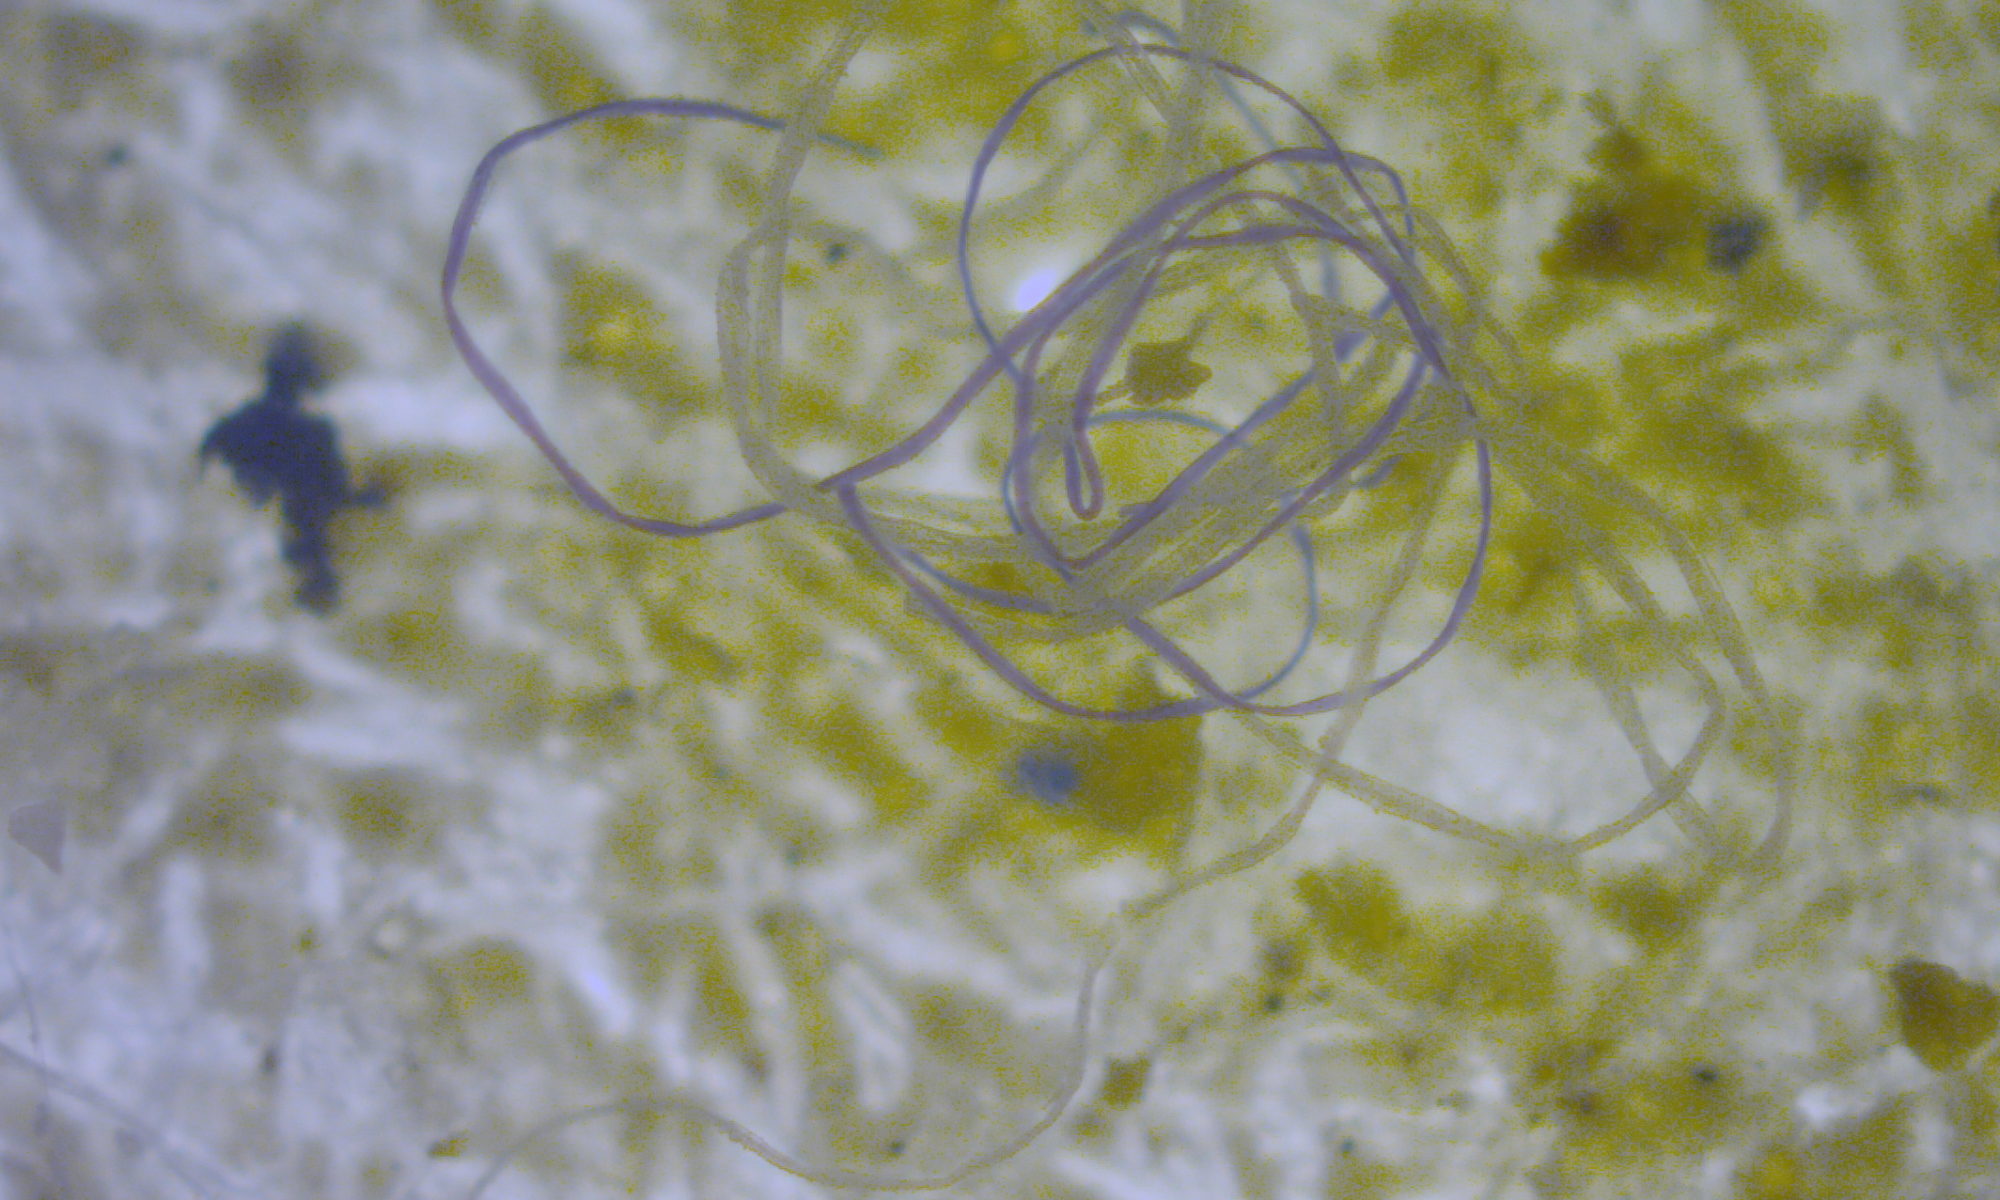
Featured image: Microplastic thread courtesy of M.Danny25 on Wikipedia under CC BY-SA 4.0.

Paper: Ross, P.S., Chastain, S., Vassilenko, E. et al. Pervasive distribution of polyester fibres in the Arctic Ocean is driven by Atlantic inputs. Nat Commun 12, 106 (2021). https://doi.org/10.1038/s41467-020-20347-1

The Arctic is full of plastic–polyester fibers to be exact. Peter S. Ross and his team found upwards of forty polyester fibers for every cubic meter of the Arctic Ocean’s surface. Their new study in Nature Communications also revealed that these fibers were more common in the East Arctic, which is fed by the Atlantic Ocean, than the West Arctic. The scientists suggest that the presence of these fibers coupled with their uneven distribution throughout the ocean could be due to an unlikely source: home laundry. 

Continue reading “There’s microplastics in the Arctic, and we can probably blame home laundry”

Tiny organisms’ race to the bottom of the ocean

Paper: Microbial dynamics of elevated carbon flux in the open ocean’s abyss

Authors: Kirsten Poff, Andy Leu, John Eppley, David Karl and Edward DeLong

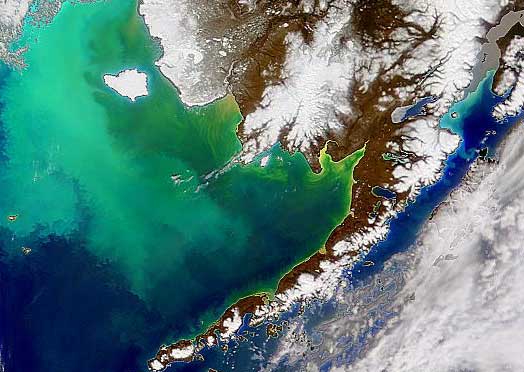
Cells from blooms of phytoplankton, or tiny plants, can enhance carbon flux all the way down to the deepest parts of the ocean. The authors of this recent study measured the amount of carbon in sinking particles deep in the ocean at a station near Hawaii. Over the course of three years, scientists identified three time periods of unusually high carbon flux, or transport, at this depth, and found that the organisms that made up the sinking particles were significantly different between high flux events and the rest of the time period. The data showed higher abundances of surface-dwelling microorganisms, including phytoplankton, contributing to these particles during high-flux events.

Continue reading “Tiny organisms’ race to the bottom of the ocean”

Cohesive trends in carbon cycling over the last 66 million years

Paper: Reconciling atmospheric CO2, weathering, and calcite compensation depth across the Cenozoic

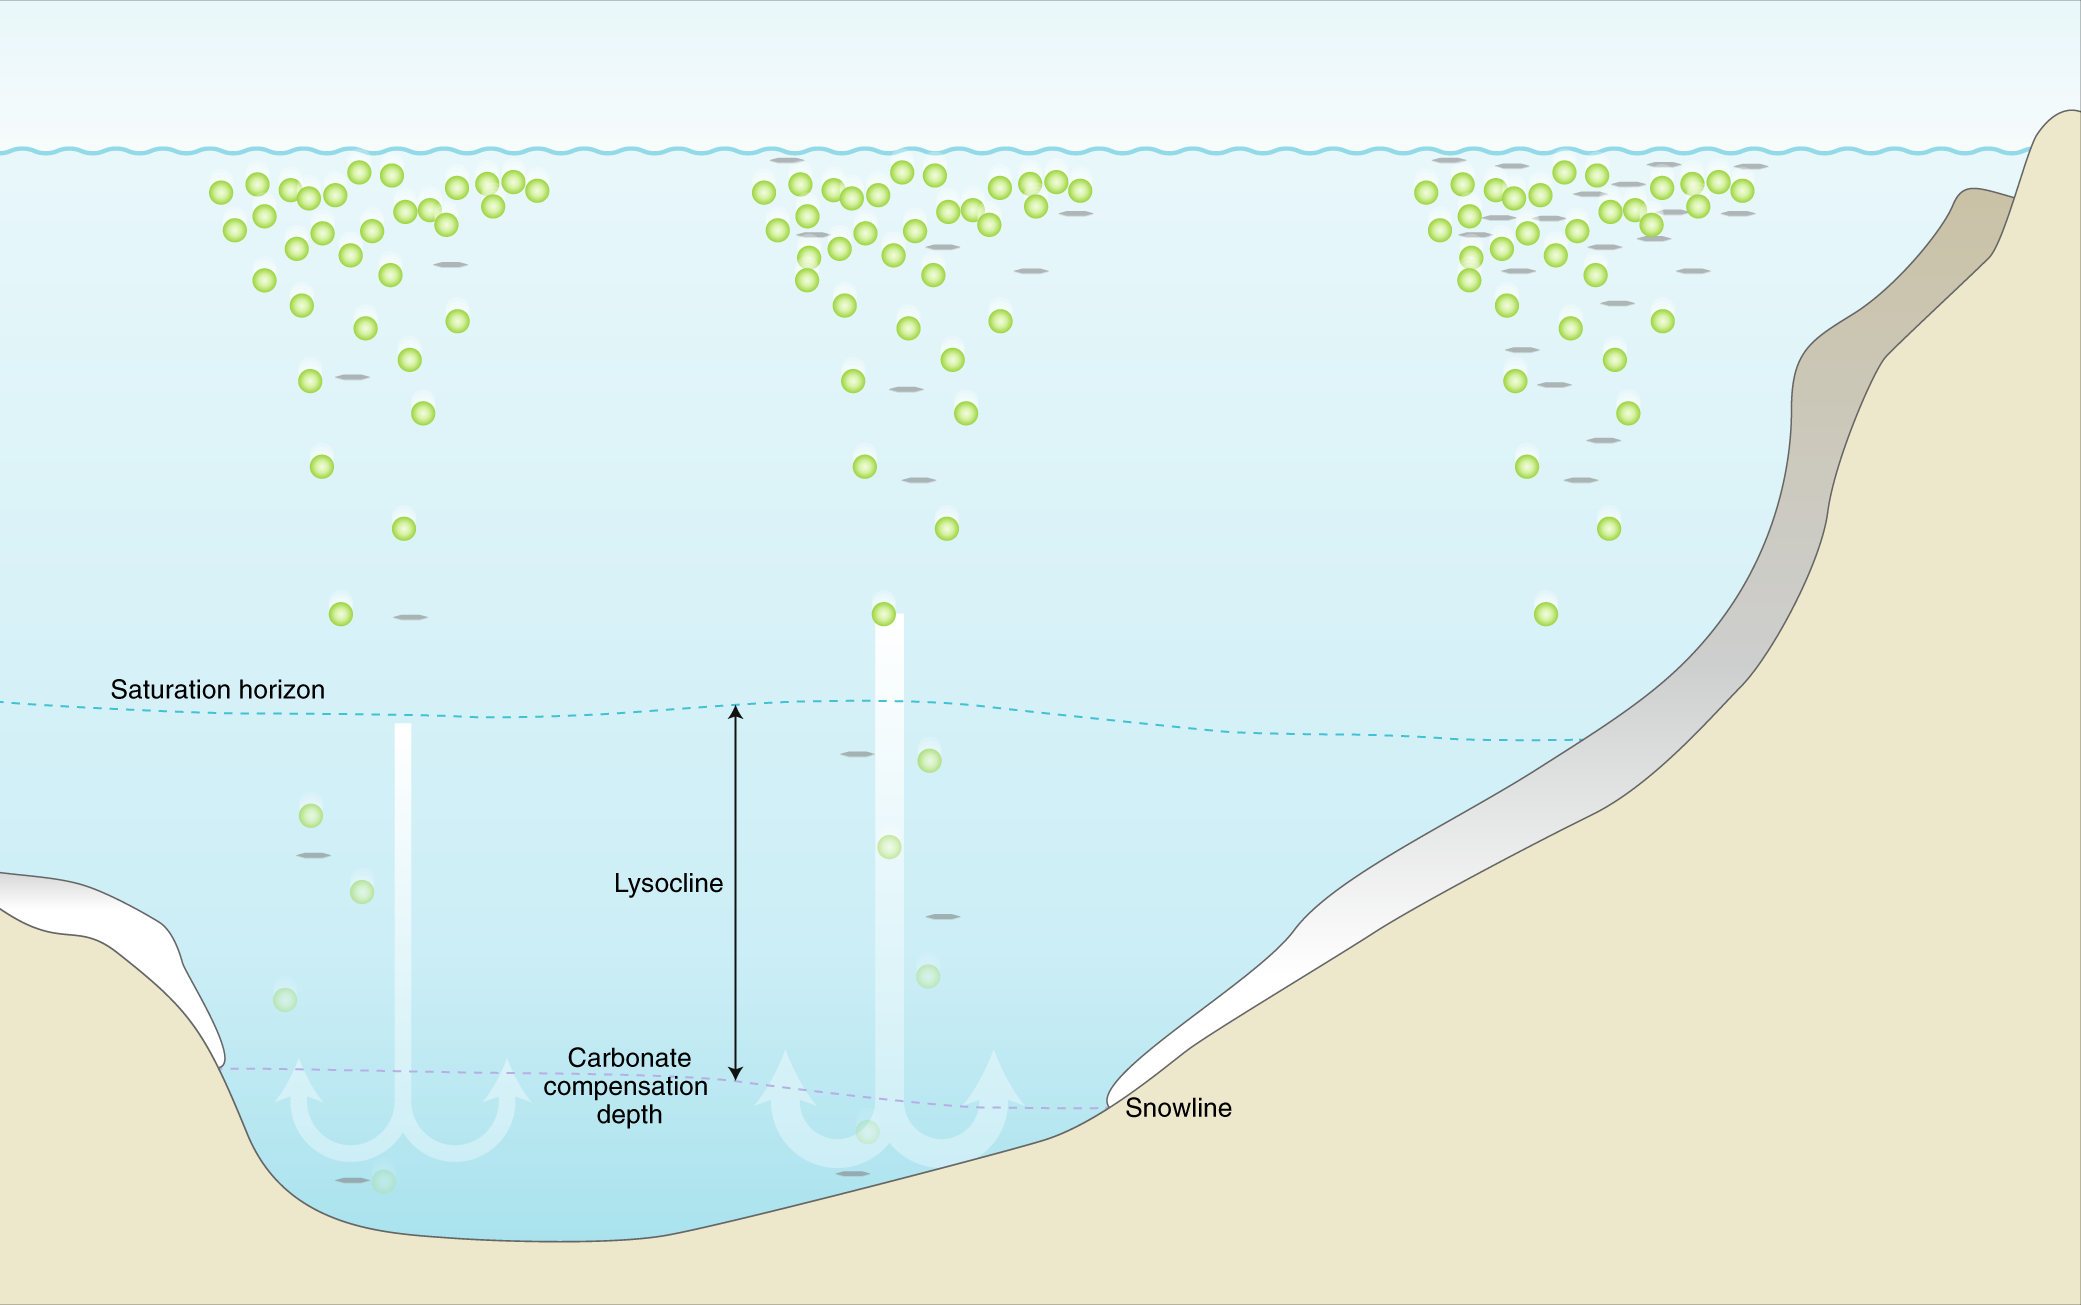
Featured image: Figure 1 from a related study: Boudreau et al., 2018 – a schematic which illustrates the carbonate/calcite compensation depth (CCD). Just as snow accumulates on mountains above the snowline and melts at lower elevations, white calcium carbonate shells and minerals (the sinking green discs in this image) accumulate on the seafloor above the CCD and dissolve below this depth.

Authors: Nemanja Komar and Richard E. Zeebe

For multiple decades, we have known that temperatures have largely cooled over the last 66 million years (during the Cenozoic, our current geological era). This insight comes from measuring oxygen isotopes in microfossil shells from ocean sediment cores that extend hundreds of meters into the deep ocean seafloor. Slight increases in the heavier oxygen isotope (which contains ten neutrons) relative to the lighter isotope (which contains eight neutrons) in these shells over time indicates cooling. However, it has been significantly more difficult to understand how the long-term geological carbon cycle has been intertwined with this temperature change. Since carbon and climate are inherently connected under modern and projected future climate change, it is crucial to understand these linkages. A new study by Komar and Zeebe expands a multi-faceted geological carbon and climate model to show how geological and geochemical evidence from ocean sediments that initially appears to be incompatible actually tells a cohesive story of carbon cycling and changes over the Cenozoic.

Continue reading “Cohesive trends in carbon cycling over the last 66 million years”

The Fate of Aquifers, and What Controls It

Paper: Divergent effects of climate change on future groundwater availability in key mid-latitude aquifers

Authors: Wen-Ying Wu, Min-Hui Lo, Yoshihide Wada, James S. Famiglietti, John T. Reager, Pat J.-F. Yeh, Agnès Ducharne, and Zong-Liang Yang

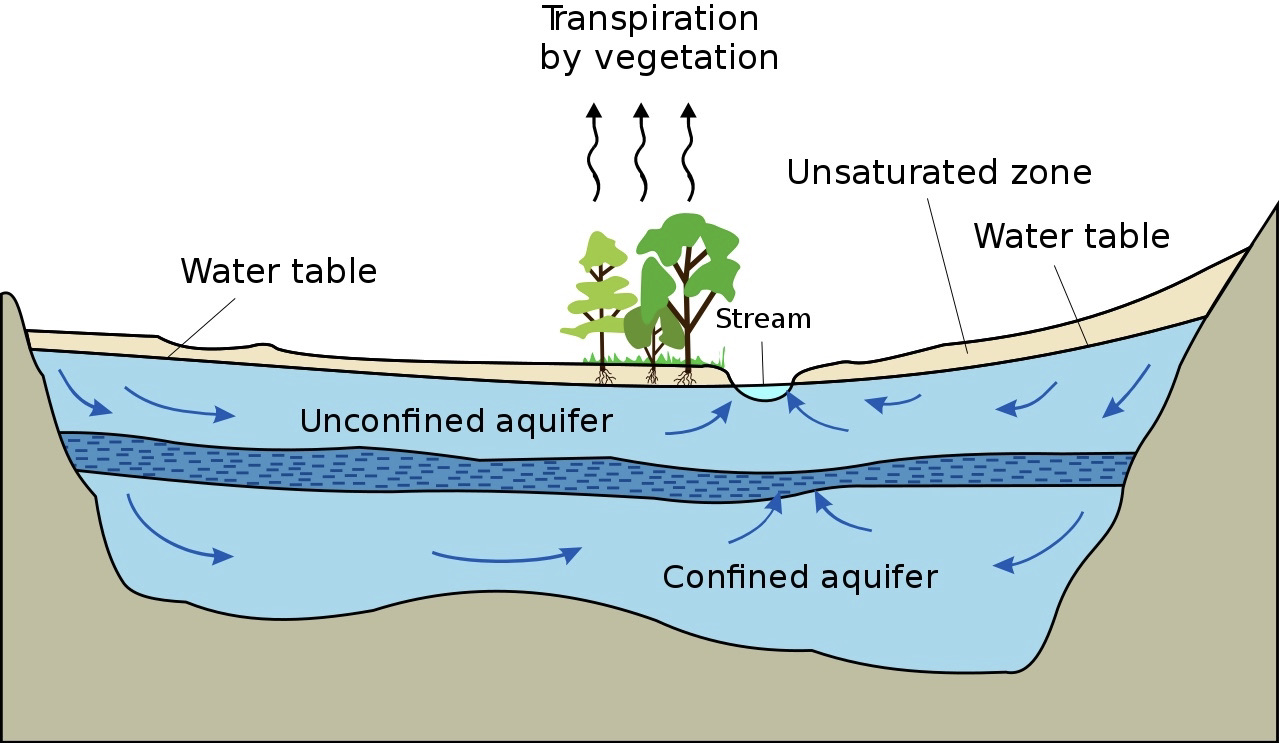
The ground I’m standing on feels solid, but it’s really full of porous rocks. The holes in these rocks are all different sizes, and water can flow through and between those with larger holes. Together, bodies of rocks that are saturated with water form aquifers. As groundwater supplies more than a third of the water humans use, groundwater and the aquifers that contain it are vital. They are especially vital in mid-latitude arid and semi-arid regions without enough surface water. In their recent research, Wen-Ying Wu and their collaborators studied the future of aquifers in such regions and what factors control it.

Continue reading “The Fate of Aquifers, and What Controls It”

Etched in stone: tracing earthquakes through archaeological ruins

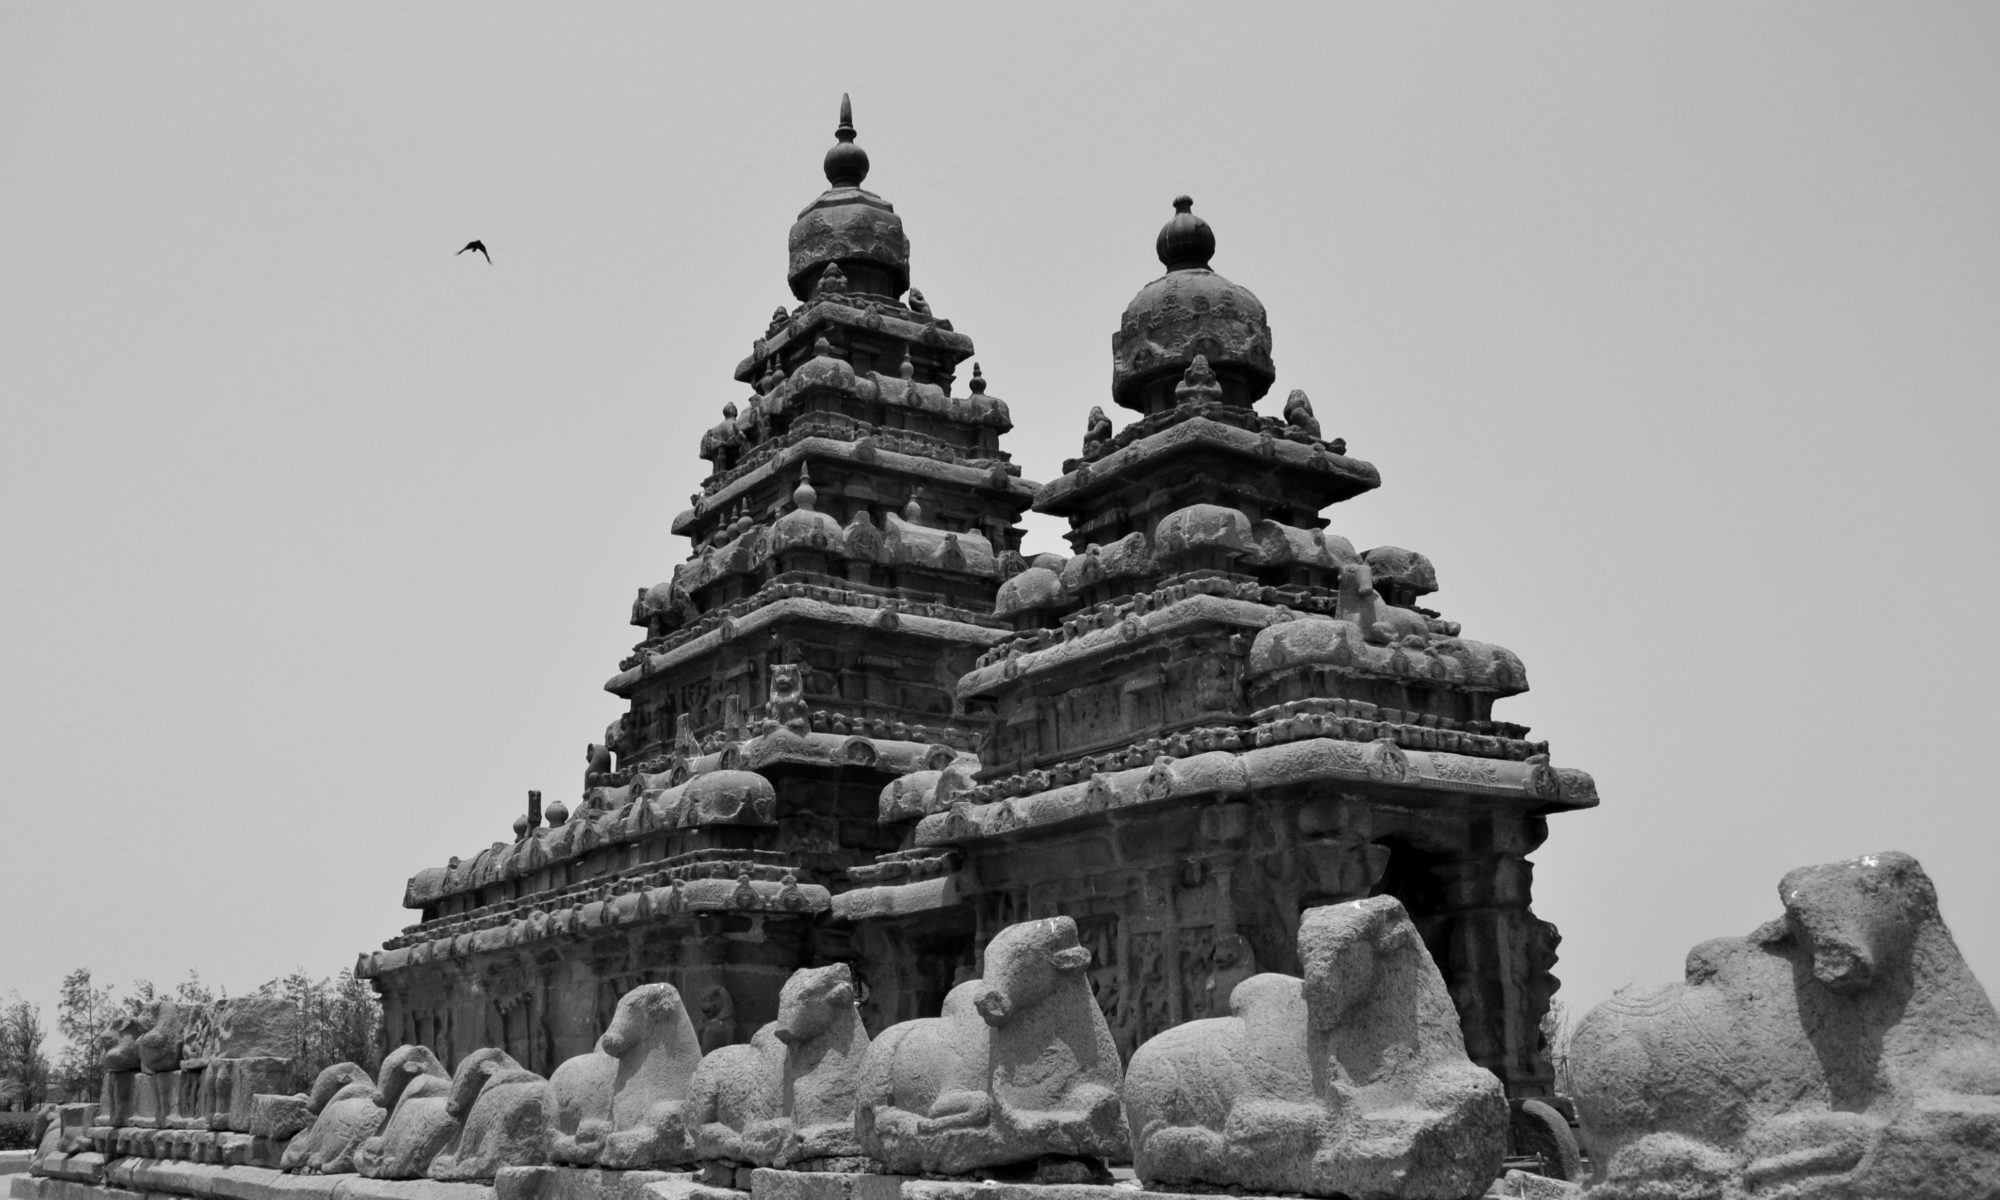
The Shore Temple at Mahabalipuram, Tamil Nadu, India

Feature image: Shore Temple at Mahabalipuram, Tamil Nadu, India by Nireekshit, CC BY-SA 3.0

Article: Archaeoseismological potential of the Indian subcontinent.

Authors: Miklós Kázmér, Ashit Baran Roy and Siddharth Prizomwala

India’s ancient monuments whisper more than just stories of past empires and civilizations: they also tell tales of its geological past. Evidence of earthquakes is etched in stone, displacements and warps that can help us identify past seismic events.

India’s documentation of earthquakes is sketchy, pieced together from historical data, monographs, and British records. In 1898, the first seismograph was established in Pune, Maharashtra, but serious instrumental recording only began when the 1967 Koyna Dam earthquake struck.Such a short record is not enough to map out active seismic regions or understand recurring earthquakes, so some scientists are turning to archaeological evidence.

Archaeoseismology studies past earthquakes by analysing damage to archaeological sites. How much damage an earthquake does to a structure depends on how hard or soft the ground beneath is, and damage may be mitigated through preventative building techniques. Earthquakes can result in shifts and tilts in masonry or brickwork, displaced walls, warped floors, missing sections, and sometimes, a complete collapse of the structure. The Earthquake Archaeological Effects (EAE) scale helps categorise the intensity of past earthquakes based on observations of structural damage.

A recent paper by Kazmer et al., looks at earthquake damage to 3 late medieval UNESCO World Heritage sites: Mahabalipuram in Tamil Nadu (7th-8th CE), the Qutub Minar complex in Delhi (12th-19th CE), and Konark near Bhubaneshwar in Odisha state (13th CE). All three sites feature masonry buildings commonly seen in 7th and 12th centuries CE architecture across the Indian subcontinent. The seismic history of the subcontinent is understudied compared to the seismically active Himalayan terrain.

The tilt of masonry wall and floor at the Shore Temple in Mahabalipuram indicates liquefaction, a sudden loss of soil stability that can be caused by a seismic shock.. In the Qutub Minar complex, damage to the minar including masonry blocks at the top of Iltutmish’s tomb with gaps of about 5 cms  are attributed to an earthquake in 1803. At Konark, smaller temples around the Sun Temple display shifted blocks. Other temples are missing a shikhara or deul, the temple spire or tower, which might have been toppled by an earthquake.

Beyond categorising such damage, archaeoseismology can indicate the date or date interval, location, and intensity for both seismically active and less active regions. Comparisons with historical records can offer broader insights into the Indian subcontinent. The volcanic plateau that forms the Indian peninsula has long been considered a ‘stable’ region, yet all 3 sites in this study located on the ‘Indian shield’ indicate otherwise – the region has seen earthquake activity in the past. 

Over the years, monuments have undergone intensive restoration by various rulers, British colonial authorities and the Archaeological Survey of India to preserve them for future generations, but in the process, the evidence of past earthquakes has been erased. Kazmer and co-authors suggest that archaeoseismic studies are conducted before all large-scale restoration projects. That way, we can ensure both the historical and geological legacies are preserved for posterity.


Etched in stone: tracing earthquakes through archaeological ruins by Devayani Khare is licensed under a Creative Commons Attribution-ShareAlike 4.0 International License.
Will Atmospheric Rivers Shift from Helpful to Harmful due to Climate Change?

Feature Image by mirobo on Pixabay

Article: The Shifting Scales of Western U.S. Landfalling Atmospheric Rivers Under Climate Change
Authors: Rhoades, A. M., Jones, A. D., Srivastava, A., Huang, H., O’Brien, T. A., Patricola, C. M., Ullrich, P. A., Wehner, M., and Zhou, Y.

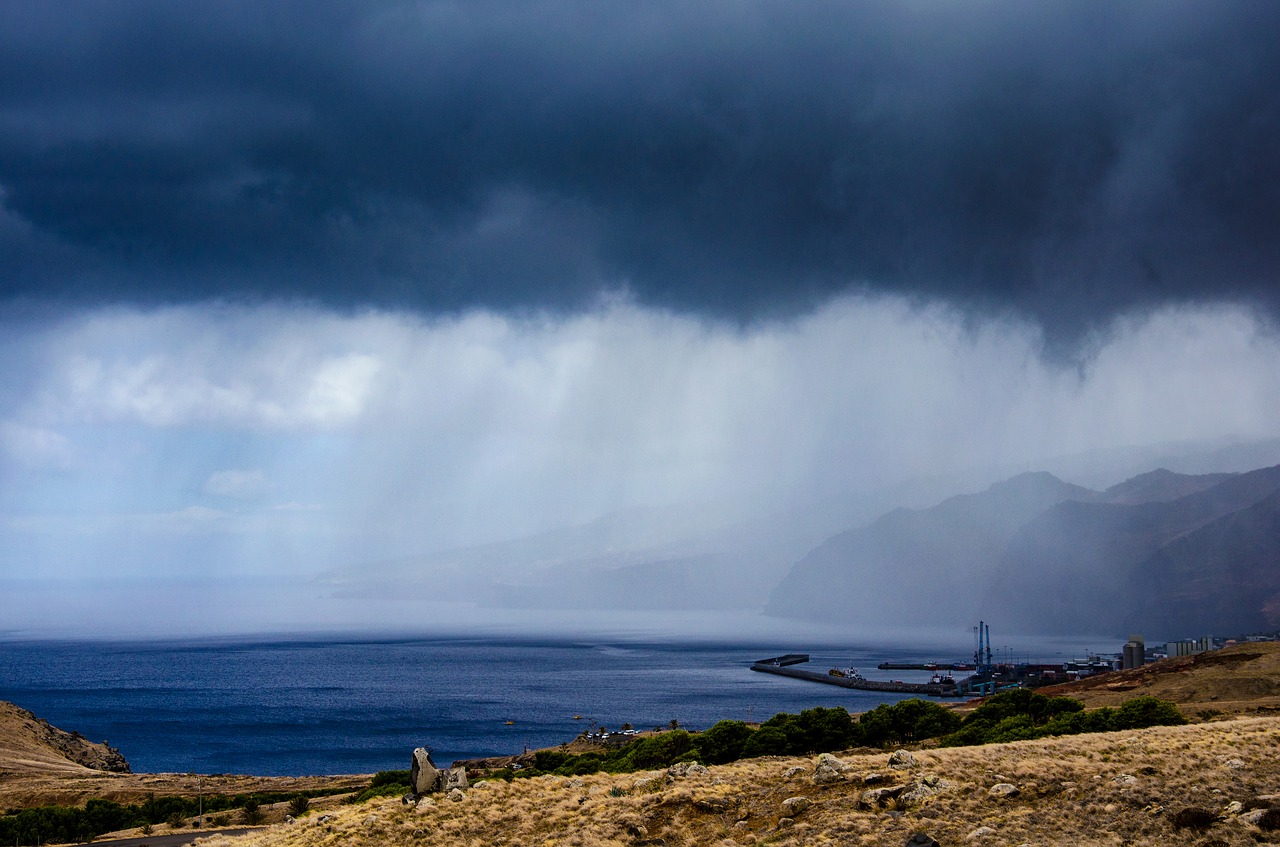
While residents of the West Coast of the United States usually don’t have to worry about hurricanes, snow storms, or tornadoes, every winter they do experience extreme weather events known as atmospheric rivers. Atmospheric rivers are plumes of highly concentrated water vapor in the atmosphere. When they move over land, they can produce very heavy rainfall that can cause flooding and even trigger landslides. However, atmospheric rivers are not all bad; in fact, some might even say they’re essential. They provide up to half of California’s rainfall every year, which is beneficial for agriculture and water supply. Like all weather events, atmospheric rivers are impacted by climate change, so how will they be different in a few decades? This question is essential for water resource managers and regular residents of the West Coast, since atmospheric rivers can both help and harm their livelihoods.

Continue reading “Will Atmospheric Rivers Shift from Helpful to Harmful due to Climate Change?”

Cooking up crystals in record time

Featured image: Example of the rock type Pegmatite. Here, crystals of the mineral tourmaline (light-dark green color), and crystals of the mineral lepidolite (pink-purple color) can be seen, sourced from Wikipedia. This file is licensed under the Creative Commons Attribution-Share Alike 3.0 Unported license.

Paper: Episodes of fast crystal growth in pegmatites

Authors: Patrick R. Phelps, Cin-Ty A. Lee, Douglas M. Morton

Anyone who has ever wandered along a pebble-ridden beach or a mountainous trail has likely picked up a rock or two, and maybe these rocks contained an array of different crystals (see image above). Perhaps these rocks then skipped along the surface of a still lake, or made their way into the pockets of a snack-ridden backpack, either to never be seen again or to be added to an ever-growing rock collection. Yet, these little pieces of Earth’s history have the potential to do so much more. With the right tools, the crystals within these rocks can be used to inform us of the geological processes that have shaped our planet Earth.

Continue reading “Cooking up crystals in record time”

Shaken, rattled, and rolled

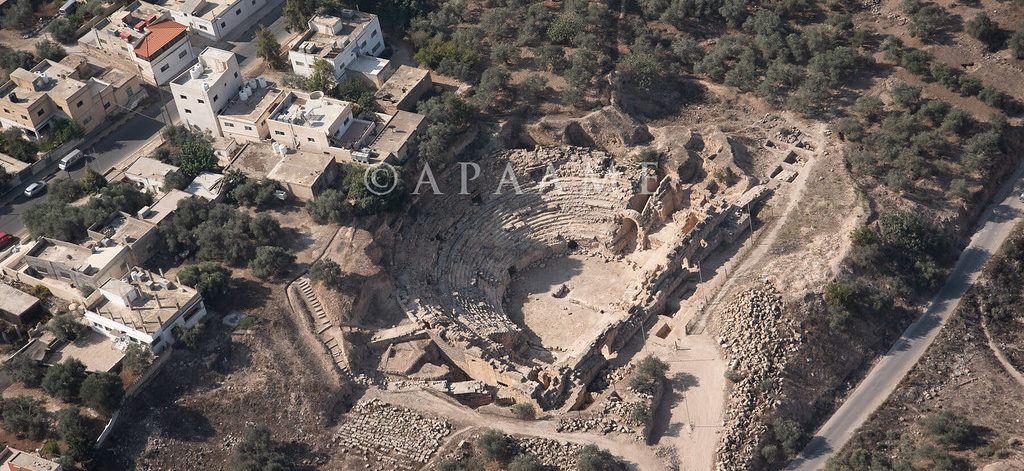
Featured image: an aerial photograph of the Capitolias/Beit-Ras theater, courtesy of the Aerial Photographic Archive of Archaeology in the Middle East (APAAME), CC-BY-NC-ND 2.0

Paper: Two inferred antique earthquake phases recorded in the Roman theater of Beit-Ras/Capitolias (Jordan)
Authors: M. Al-Tawalbeh, R. Jaradat, K. Al-Bashaireh, A. Al-Rawabdeh, A. Gharaibeh, B. Khrisat, and M. Kázmér

One of the biggest questions in earthquake seismology is whether we can see into the future, to forecast seismic activity based on what we know about faults and how they behave. We’re about as likely to accurately predict earthquakes as we are to see the future in a crystal ball, but one way we can improve our forecasts of seismic hazard actually involves looking in the other direction: back into the past.

Continue reading “Shaken, rattled, and rolled”